Kai (Kent) Wu
20' M.S. in Financial Engineering at Columbia University
Seeking full time opportunities in quantitative finance/fintech/analytics
View My LinkedIn Profile
Text-based Industry Reclassification and Industry Momentum
Project Overview: This is the abridged version of my graduate thesis at Renmin University of China, completed during the spring of 2019. I built a new industry classification for China’s listed companies using product & services descriptions disclosed in annual/semi-annual reports. This classification performed well as compared to conventional classifications. Consistent with a behavioral finance perspective, the new industry momentum factor, calculated as the average past return of industy peers, was proved to have much stronger predictive power for future stock returns than conventional industry momentum factor.
1. Motivation
Conventional industry classifications typically categorize a company into one industry. However, in China a large proportion of listed companies have their business spanned across several industries or sectors. Investors who rely on conventional classifications thus tend to ignore industry-level information relevant to a focal company’s secondary business, resulting in delayed incorporation of such less invisible information into stock prices — a phenomenon called limited attention in behavioral finance literature. Ideally, capturing the information that investors overlook would help better predict future stock returns.
2. Methodology: Text-based Industry Classification
My idea of using text data for industry reclassification originated from my internship at an NLP tech startup. However, when I did my graduate thesis, Hoberg and Phillips (2016) already proposed a solution that had been widely accepted in academia. Hence, the following steps are based on their paper, with some steps adjusted or newly added to be compatible with Chinese language.
Starting from the 2015 annual report (and the 2017 semi-annual report), the China Securities Regulatory Commission(henceforth CSRC) requires listed companies to disclose their business profiles. This section contains a large number of vocabulary related to the company’s products and services. If the product & services descriptions of two companies are similar, they probably belong to the same industries. Based on this observation, my study uses text information to redo the industry classification. The specific steps are as follows:
- Webscraping: annual and semi-annual reports are automatically collected from elangshen
- Text cleaning:
- Extract product & services descriptions using regular expressions; remove tables for they are mostly either irrelavant or boilerplates
- Tokenize the text and keep nouns
- Remove high frequency words and rare words, as they introduce noise
- Remove reports that have few unique words
- Map text into vectors following the Bag-of-Words model: Denote the normalized vector of company
 at period
  as
as 
- Cacluate similarity scores between any two comany-period observations
- Calculate text vector distances using cosine similarity: Denote the cosine similarity between comany and company
 at period as
- Calculate similarity scores:
 , where
  is the set of companies at period .
- Calculate text vector distances using cosine similarity: Denote the cosine similarity between comany
- Define industry peers:
- For a focal company , its industry peer at period is defined as:

- Use Shenwan Industry Classification (henceforth SWS Ind) to determine the value of
 : set in a way that at period , the number of industry pairs defined by text is approximate to that defined by SWS Ind
- For a focal company
The definition of industry peers here makes it more like a network than a classification. In fact, the classification proposed by Hoberg and Phillips (2016) was named Text-based Network Industries (TNIC for short).
SWS Ind is the most popular industry classification among finance practioners in China. This study thus uses SWS Ind as the major benchmark. CSRC has also published industry classification (denoted as CSRC Ind for short), which is the default choice in academic research. But as you will see later, CSRC Ind performs worse than SWS Ind.
When working on this thesis, the annual report for fiscal year 2018 was not completely availble. Consequently, I gathered five periods of reports that had product & services information disclosed. Industry reclassification, namely the process described above on how to define industry peers, was conducted on Apr 30 (Aug 31) when most annual(semi-annual) reports had been made public. To further avoid look-ahead bias, the text for companies that failed to issue reports before the expected date was not updated.
Table 1 number of companies with at least one industry peer:
| 2015A | 2016A | 2017H | 2017A | 2018H |
|---|---|---|---|---|
| 2687 | 3035 | 3248 | 3431 | 3501 |
As shown in Table 1, text-based industry covers 95% ~ 99% of the entire A-share universe.
Table 2 descriptive statistics: number of industry peers for a focal company
| 2015A | 2016A | 2017H | 2017A | 2018H | |
|---|---|---|---|---|---|
| mean | 51.95 | 57.62 | 61.61 | 65.91 | 67.03 |
| std | 36.97 | 43.72 | 43.89 | 52.96 | 52.41 |
| min | 1 | 1 | 1 | 1 | 1 |
| 25% | 23 | 23 | 27 | 23 | 26 |
| 50% | 43 | 46 | 51 | 51 | 53 |
| 75% | 72 | 81 | 86 | 95 | 94 |
| max | 215 | 225 | 264 | 284 | 292 |
Table 2 shows the distribution of the number of industry peers a focal company has under the text-based industry classification. For comparison, Table 3 lists the same statistics when using SWS Ind, for the same universe of stocks. Obviously, the order statistics are of comparable scale, which results directly from using SWS Ind as a benchmark.
Table 3 descriptive statistics: number of industry peers for a focal company defined by SWS Ind
| 2015A | 2016A | 2017H | 2017A | 2018H | |
|---|---|---|---|---|---|
| mean | 54.54 | 60.90 | 62.91 | 67.03 | 67.43 |
| std | 43.02 | 47.41 | 47.93 | 51.40 | 51.77 |
| min | 0 | 0 | 0 | 0 | 0 |
| 25% | 22 | 27 | 29 | 29 | 31 |
| 50% | 41 | 44 | 47 | 49 | 50 |
| 75% | 69 | 81 | 87 | 96 | 100 |
| max | 159 | 177 | 177 | 193 | 194 |
3. Classification Performance
In this section, I try to demonstrate the desirable characteristics of text-based classification using both qualitative and quantitative methods.
3.1 The SWS Inds of Industry Peers
The table below shows two randomly selected focal companies and the SWS Inds corresponding to their industry peers. In both cases, the majority of peer firms have their SWS Inds highly consistent with the focal company. For example, among the 178 peers of Renfu Medicine, which is a pharmaceutical manufacturer, 98 are from the traditional Chinese medicine industry, the pharmaceutical production industry and the biological products industry. It is of course not by coincidence. Comapnies with closely related Shenwan Industries tend to use similar vocabulary when describing their businesses, which is captured by my text-based industry classification.
Table 4
| Stock Name and Ticker | SWS Ind | Frequencies of SWS Inds among Industry Peers |
|---|---|---|
| Phoenix Media 601928.SH | cultural media | cultural media [36], computer applications [17], internet media [10], communication equipment [6], marketing communications [4], general retail [3], computer equipment [3], chemicals [2], professional retail [2], commercial property management [2], real estate development [1], optical optoelectronics [1], hotel [1], clothing home textiles [1], textile manufacturing [1], household light industry [1], papermaking [1], packaging and printing [1], audio-visual equipment [1], food processing [1], comprehensive [1] |
| Renfu Medicine 600079.SH | pharmaceutical production | traditional Chinese medicine [44], pharmaceutical production [40], biological products [14], securities [13], banks [9], pharmaceutical business [8], medical services [6], chemicals [5], medical devices [5] , comprehensive [5], animal health [3], special equipment [3], clothing home textile [2], infrastructure [2], food processing [2], chemical fiber [2], real estate development [2], cultural media [1], semiconductor [1], automotive parts [1], park development [1], cement manufacturing [1], water [1], high and low voltage equipment [1], trade [1], motor [1], plastic [1], coal mining [1], metal products [1], internet media [1] |
3.2 High Frequency Words in Product & Services Descriptions of Industry Peers
Below is another interesting table showing two randomly selected focal companies and the top 30 high-frequency words in the product & services descriptions of their industry peers. To some extent, we can guess the industry of the focal company simply by reading the most frequent words used by its industry peers. For example, in the case of Northeast Securities almost all words are directly related to finance. This finding further demonstrates the feasibility of text-based industry classification.
Table5
| Stock Name and Ticker | SWS Ind | Top 30 High-frequency Words in the Product & Services Descriptions of Industry Peers |
|---|---|---|
| Northeast Securities 000686.SZ | securities | banks [84], securities [82], financing [81], funds [79], transactions [71], supervision [69], bonds [66], income [65], finance [64], credit [63], Consultation [58], wealth [58], transformation [56], private placement [55], entity [54], compliance [54], RMB [54], feature [53], stock [53], consultant [51] brokerage [51], futures [51], regulation [50], individual [49], asset management [48], underwriting [48], structure [46], insurance [46], equity [45], investors [45] |
| Hainan Mining 601969.SH | mining | reserves [30], minerals [29], mining [29], mines [28], metals [27], mining [26], mines [26], smelting [24], grades [23], yields [23], Mining area [23], exchange [23], ore [22], mining [22], raw materials [21], exploration [21], copper [20], use [20], quantity [20], geology [20] , mineral processing [20], trade [19], solid [19], non-ferrous metals [18], exploration [18], securities [17], utilization [17], production capacity [17], production capacity [16], chemical industry [16] |
Note: duplicated words are due to translation
3.3 Identify the Most Related SWS Ind Pairs
Here comes my favorite part. Although we can somehow know the degree of association between any two SWS Inds simply according to their names, from now on we pretend to have no prior knowledge about these industries at all. Instead, by assuming that text-based industry classifcation is a good classification, I demonstrate a way to pick out the most related SWS Ind pairs.
As we see in 3.1, industry peers of a focal company come from different SWS Inds. Intuitively, the more related two SWS Inds are, the more likely that they appear simultaneously. There are at least two supporting arguments. First, as mentioned, companies from related Shenwan Industries tend to share similar vocabulary in their reports, and are thus more likely to appear as the peers of the same focal company. Second, for a focal company with diversified businesses, concentric diversification is more likely to happen, in which the company develops products or services closely related with its current core business. If text-based classifcation captures the diversification of the focal company, then different but highly related SWS Inds are more likely to coappear. Based on this observation, I implemented the following steps to quantify the degree of associations between two SWS Ind pairs.
- Caculate the Coappear Score: for a given SWS Ind pair
 and
and  , the Coappear Score is equal to the sum of the multiplications of frequencies, iterated over all focal companies’ industry peers.
  , where
  represents the industry peers for focal company , and
  represents the frequency of companies belonging to SWS Ind that are meanwhile industry peers of company .
 - Use Monte Carlo Simulation to calculate the part of Coappear Score attributed to SWS Ind distribution: a high Coappear Score does not necessarily means that two SWS Inds are highly correlated. Chances are that they frequently coappear because they both contain a large number of companies. If assigning industry peers randomly, then the Pseudo Coappear Score should only reflect the total number of companies in each industry, and is thus able to explain the part of Coappear Score purely attributed to SWS Ind distribution. I thus implemented a Monte Carlo Simulation of 100 rounds, where at each round companies are randomly assigned to be other focal companies’ industry peers, keeping for each company the nunmber of industry peers as well as the number of times of being industry peers fixed. The Pseudo Coappear Score for SWS Inds and is calculated as
 , where
  is the Coappear Score between and in
  .
. - Calculate the Normalized Coappear Score as the final score:

There are 5,356 potential SWS Ind pairs. Listed below are the top 50 SWS Ind pairs ranked by Normalized Coappear Score. The result is pretty impressive: we identify highly related industry pairs without using prior knowledge. The result further lends credence to text-based industry classification.
Table 6 Top 50 Most Related SWS Ind Pairs
| 1. airport & air freight | 2. port & rail transport | 3. port & shipping | 4. food & beverage manufacturing |
| 5. livestock and poultry farming & feed | 6. tourism & attractions | 7. oil exploitation & Mining service | 8. shipping & rail transport |
| 9. airport & port | 10. insurance & securities | 11. rare metal & gold | 12. fishery & livestock and poultry farming |
| 13. animal health & livestock and poultry farming | 14. airport & shipping | 15. ground equipment & aerospace equipment | 16. securities & bank |
| 17. other mining & gold | 18. livestock and poultry farming & crop farming | 19. diversified finance & securities | 20. insurance & bank |
| 21. bus & airport | 22. water & environmental engineering and services | 23. attractions & hotel | 24. animal health & feed |
| 25. other mining & rare metal | 26. agricultural integration & crop farming | 27. insurance & diversified finance | 28. diversified finance & bank |
| 29. airport & rail transport | 30. traditional Chinese medicine & chemical and pharmaceutical | 31. infrastructure & housing construction | 32. industrial metal & gold |
| 33. chemical and pharmaceutical & biological product | 34. bus & rail transport | 35. tourism & hotel | 36. traditional Chinese medicine & biological product |
| 37. bus & air freight | 38. ground equipment & aviation equipment | 39. fishery & feed | 40. industrial metal & rare metal |
| 41. coal mining & rail transport | 42. park development & real estate development | 43. garden engineering & water | 44. general retail & clothing |
| 45. fishery & crop farming | 46. aerospace equipment & aviation equipment | 47. Internet media & marketing communications | |
| 48. animal health & fishery | 49. general retail & commercial property management | 50. medical service & biological product |
3.4 Explanatory Power of Industry-level Variables
Companies in the same industry should also exhibit similar patterns in a wide variety of variables, including valuation multiples (PE ratio, book to market ratio), profitability (return on asset, return on equity), operating efficiency (asset turnover ratio), growth potential (annual sales growth), debt capacity (debt ratio), R&D expense ratio and analyst forecasted growth. If a classification is indeed well-defined, then an industry-level variable aggregated from the composite companies should have great explanatory power on company-level variables, hence a relatively high regression R-squared.
I used the following company-wise regression to compare CSRC Ind, SWS Ind and text-based industry classification.  can be any of the variables mentioned above, and
  is the corresponding industry average excluding company :

Table 7 summarizes all the adjusted R-squared obtained from the regressions. SWS Ind and TNIC both win 4 battles, and tie in one. CSRC Ind fails to win even one battle. Notably, although the SWS Ind is the most popular one to financial analysts, it falls behind text-based industry classification in the test where analyst forecasted growth is the variable of interest. Such a result seems to indicate that analysts will identify comparable companies based on their own understanding, rather than fully relying on established industry classifications.
Table 7 Regress Company-level Variable on Industry-level Variable: R-squared results
| Variables | CSRC Ind | SWS Ind | TNIC | # Samples |
|---|---|---|---|---|
| EP | 18.09% | 18.25% | 11.17% | 9139 |
| BM | 26.55% | 27.80% | 27.80% | 9139 |
| ROA | 8.71% | 8.38% | 12.38% | 9139 |
| ROE | 6.53% | 6.38% | 7.42% | 9113 |
| TURNOVER | 27.21% | 29.83% | 27.93% | 9139 |
| GROWTH | 5.68% | 6.00% | 3.63% | 9139 |
| DEBT | 22.72% | 24.20% | 27.61% | 9139 |
| RD EXPENSE | 41.98% | 44.20% | 43.08% | 9139 |
| FORECAST GROWTH | 5.68% | 7.00% | 8.61% | 6314 |
Note: 1. EP takes the reciprocal of PE ratio to account for negative values; 2. Bold format indicates the best among three
4. Text-based Industry Momentum
I have demonstrated above that text-based industry classification is reliable. Obviously, it can capture some of the industry characteristics which is not directly reflected in a conventional classification scheme. To illustrate, a real estate company with food manufacturing taking up 25% percent of its yearly revenue is categorized to real estate industry, but its text-based industry peers will include many food manufactuers. Investors, subjected to limited attention from a behavioral finance perspective, tend to ignore this fact.
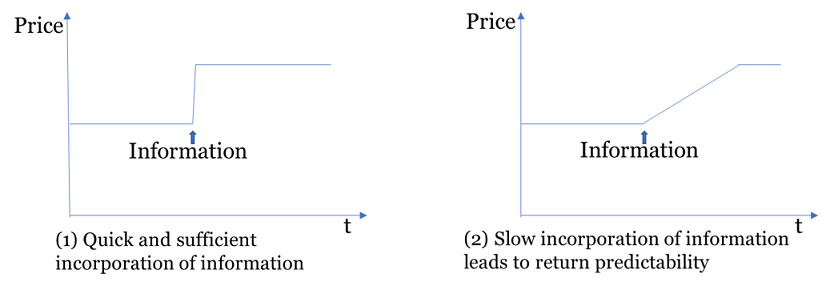
The momentum effect is a common market phenomenon by which asset prices follow an upward or downward trend for a long time. As a result, the past return of the asset, usually named momentum factor, can predict future return. Likewise, industry momentum can be defined as the industry-level past return, and (in this study) its predictive power for stock future returns is called industry momentum effect. Formally, we can define the industry momentum of company during period as the average stock return of its industry peers during period .  where
where  . Here I extend the concept of
  to conventional classifications so that two comapnies belonging to the same industry are automatically industry peers.
As industry momentum can proxy for industry-level information, and the text-based industry classification captures industry associations that investors overlook, the text-based industry momentum will contain relevant industry-level information that slowly affects stock prices, resulting in a stronger industry momentum effect. This section presents my investigation.
4.1 Fama-Macbeth Cross-sectional Regression
First, I use Fama-Macbeth regressions to test different industry momentums on their explanatory power for stock returns. The two regressions are listed below. All return related variables are weekly returns, because in China researchers have concluded that momentum effect only exists in the short term —— in the long term it is reversal effect that predominates.  is the weekly return of company at week
  , which controls for individual stock momentum.
  is the logarithmic of market value and
  is the logarithmic of book-to-market ratio. In the first regression, I only include the industry momentum that lagged for 1 week, while in the second one industry momentum lagged for 1 to 4 weeks are all included, with the same set of control variables.
To ensure that different coefficients are directly comparable, all independent variables are normalized to the corresponding z-scores.
is the logarithmic of book-to-market ratio. In the first regression, I only include the industry momentum that lagged for 1 week, while in the second one industry momentum lagged for 1 to 4 weeks are all included, with the same set of control variables.
To ensure that different coefficients are directly comparable, all independent variables are normalized to the corresponding z-scores.


Table 8 summarizes the results from the first regression. Ceteris paribus, the text-based industry momentum generates the largest coefficient, t-statistics and adjusted R-squared. To my expectation, CSRC Industry Momentum is the least significant. Notably, controlling for industry momentum, the coefficients for individual stock momentum are all significantly negative, meaning that reversal is stronger than momentum.
Table 8 Fama-Macbeth Regression: including one industry momentum

Table 9 shows the results from the second regression. Industry momentums lagged for 1 week are still significantly positive, but the other industry momentums are not. Text-based industry momentum is still the strongest.
Table 9 Fama-Macbeth Regression: including four industry momentums

4.2 Portfolio Backtest
In this section, I implement portfolio backtests based on industry momentum factors. The test procedure originates from Jegadeesh and Titman (1993) which was the first paper to consolidate the findings of momentum effect. Sort all the stocks by their industry momentums during the past  weeks, namely the formation weeks, and divide them into ten groups. For a newly formed group ranging from 1 to 10, we buy all the stocks with equal weights and hold for K weeks as the holding period. This process repeats at the begining of each week, so that at week , each portfolios consists of K sub-portfolios which are formed during week
  to week . By convention, the first group which corresponds to the smallest industry momentum is called the Short Portfolio, and the 10th group is called the Long Portfolio.
The above backtest is conducted for the CSRC, SWS as well as text-based industry momentums, respectively, with the formation weeks and the holding weeks  varying between 1 to 12. The image below compares the backtesting results, where the vertical axis is the difference of annualized returns between the Long and the Short Portfolios. As we can see, the text-based industry momentum (right most) is the absolute winner.
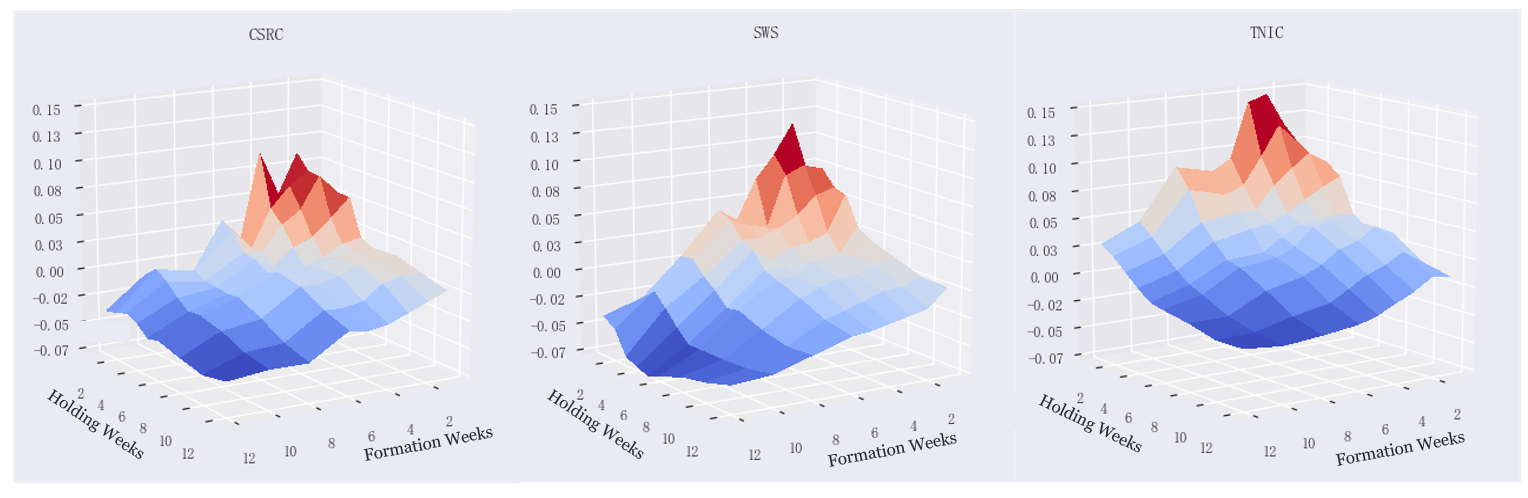
Table 10 compares the backtesting outcomes of text-based industry momentum with SWS momentum, with a 3-week formation period and various holding periods. “Annualized excess return/Long(Short)” is the annualized return of the Long(Short) Portfolio minus equal-weighted annualized return of the whole stock universe. “Long - Short” is the difference of annualized returns between the Long and the Short Portfolio. “FF 3 factor alpha” is the intercept term obtained when regressing monthly returns of Long-short portfolio on monthly Fama-French 3 factors, which represents the risk premium after controling for systematic risks. “Alpha t-statistics” is the t-stat of the intercept term. The last metric, factor monotonicity, is the Spearman correlation coefficient between each portfolio’s group number (1 to 10) and the final netvalue. This metric is based on my argument that an ideal stock factor should have considerable postive/negative correlation with future stock returns. Hence, the desirbale factor monotonicity should have an absolute value close or equal to 1.
Table 10 Performance Comparison in Jegadeesh and Titman Test
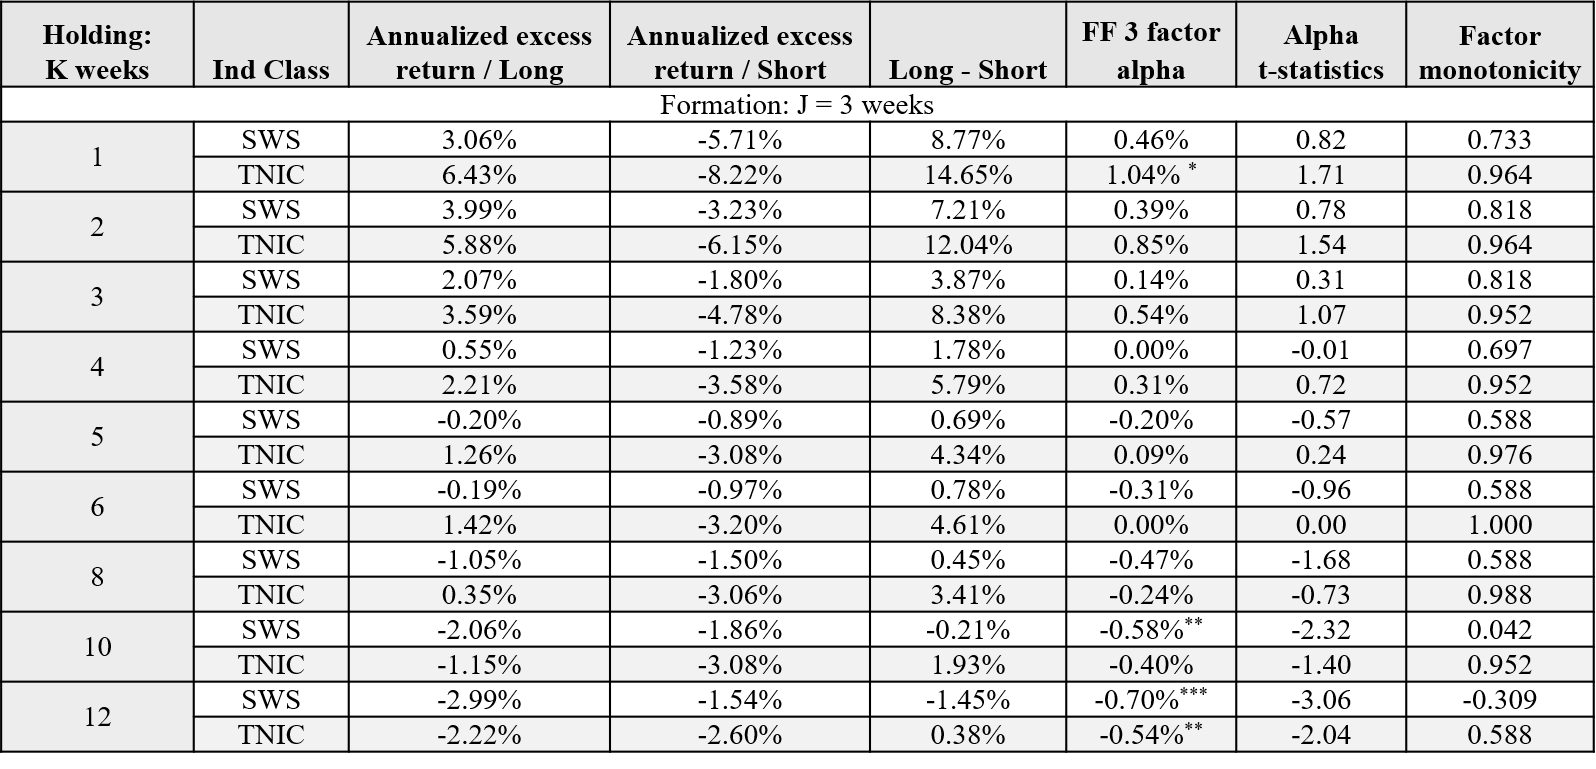 Note: ***, ** and * indicate significance levels of 1%, 5% and 10%
As exhibited in Table 10, the text-based industry momentum is 100% dominant over SWS Ind momentum. The factor monotonicity score is the most impressive —— the monotonicity of 10 portfolios does not decay even when the holding period is raised to 10 weeks. Also worth mentioning is the FF 3 factor alpha. The monthly alpha when the holding period is 1-week is 1.04% which is significant at 10% level. The fact that it is not quite significant may be due to the lack of enough samples in regression. Recall that we use monthly return for this regression, which means the number of available observations reduces to no more than a quater of the original. Therefore, a 10% significance level here is somewhat acceptable.
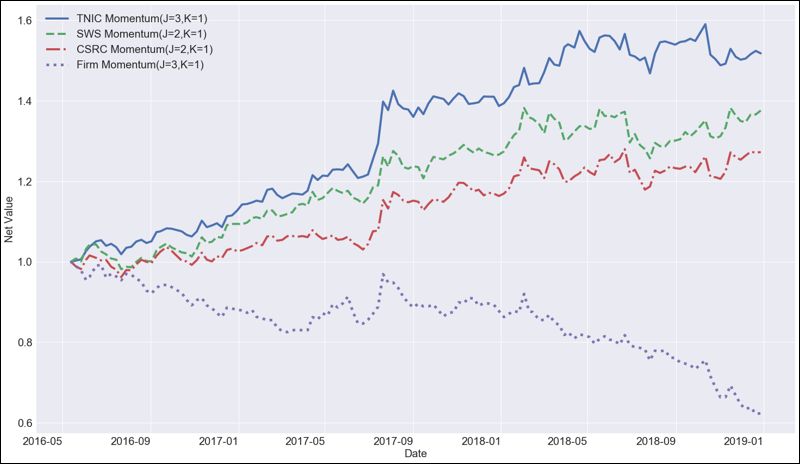
The last image shows the equity curves for different types of industry momentums, with the formation period and the holding period set to be optimal. Again, the text-based industry momentum wins. The lowest curve corresponds to the backtest that sorts stocks by stock-level momentum. Its negative slope casts doubts on the existence of stock momentum effect in China’s A-share Market.
4.2 Mechanism Test
To my expectation, the text-based industry momentum effect is stronger. I have argued that it is because of investors’ inattention to relevant industry information, which is caused by the conventional classification that categorizes a multi-sector company to a single industry. Since my text-based classification is designed to overcome this drawback, it captures the information less visible investors, and the corresponding industry momentum can thus better predict future stock returns.
Here I give an indirect test of the proposed mechanism. I decompose the text-based industry momentum into two parts. The first part is the visible momentum, which is the average past return of text-based industry peers that are also peers under SWS Ind. The second part is the invisible momentum, which is defined using text-based industry peers that are not identified as peers under SWS Ind. I use these two industry momentums as the independent variables in place of the orginal industry momentum, and repeat the two regressions listed in section 4.1. The result shows that the coefficient of invisible momentum is 50% larger, which to some extent supports the behaviroal finance perspective.
Table 11 Fama-Macbeth Regression: Invisible/Visible Momentum

5. Concluding Remarks
- Text-based industry classification is practical in China’s A-share Market. It is able to capture industry associations that are not direclty obtainable using conventional classifications, which fits the reality that most big companies have diversified business across different industries. It is not inferior to the most popular classification schema —— Shenwan Industry Classification —— in a direct comparison test.
- Industry momentum effect exists in China’s market, but the effect lasts for weeks rather than for months. Text-based industry momentum is significantly stronger than industry momentum defined using conventional classification schemes.
- Limited investor attention might be the potential cause of the stronger text-based industry momentum effect.
As corporate reports will continue to be released, we can collect more data to further test the robustness of these findings.
References:
I only list publications that are directly related to this post. My actual graudate thesis presents much more items.
- Bhojraj S, Lee C M C, Oler D K. What’s my line? A comparison of industry classification schemes for capital market research[J]. Journal of Accounting Research, 2003, 41(5): 745-774.
- Bhojraj S, Lee C M C. Who is my peer? A valuation‐based approach to the selection of comparable firms[J]. Journal of accounting research, 2002, 40(2): 407-439.
- Cohen L, Frazzini A. Economic links and predictable returns[J]. The Journal of Finance, 2008, 63(4): 1977-2011.
- Cohen L, Lou D. Complicated firms[J]. Journal of financial economics, 2012, 104(2): 383-400.
- Hoberg G, Maksimovic V. Redefining financial constraints: A text-based analysis[J]. The Review of Financial Studies, 2014, 28(5): 1312-1352.
- Hoberg G, Phillips G M. Text-based industry momentum[J]. Journal of Financial and Quantitative Analysis, 2018, 53(6): 2355-2388.
- Hoberg G, Phillips G. Conglomerate industry choice and product language[J]. Management Science, 2017, 64(8): 3735-3755.
- Hoberg G, Phillips G. Product market synergies and competition in mergers and acquisitions: A text-based analysis[J]. The Review of Financial Studies, 2010, 23(10): 3773-3811.
- Hoberg G, Phillips G. Text-based network industries and endogenous product differentiation[J]. Journal of Political Economy, 2016, 124(5): 1423-1465.
- Jegadeesh N, Titman S. Returns to buying winners and selling losers: Implications for stock market efficiency[J]. The Journal of finance, 1993, 48(1): 65-91.
- Lee C M C, Ma P, Wang C C Y. Search-based peer firms: Aggregating investor perceptions through internet co-searches[J]. Journal of Financial Economics, 2015, 116(2): 410-431.
- Lee C M C, Sun S T, Wang R, et al. Technological links and predictable returns[J]. Journal of Financial Economics, 2018.
- Li N. Who Are My Peers? Labor Market Peer Firms Through Employees’ Internet Co-Search Patterns[J]. Labor Market Peer Firms Through Employees’ Internet Co-Search Patterns (November 1, 2017). Rotman School of Management Working Paper, 2017 (2558271).
- Moskowitz T J, Grinblatt M. Do industries explain momentum?[J]. The Journal of finance, 1999, 54(4): 1249-1290.